

About Manuel Amunategui
Data scientist with over 20-years experience in the tech industry, MAs in Predictive Analytics and
International Administration, co-author of Monetizing Machine Learning and VP of Data Science at SpringML.
From consulting in machine learning, healthcare modeling, 6 years on Wall Street in the financial industry, and 4 years at Microsoft, I feel like I’ve seen it all. And this has opened my eyes to the huge gap in educational material on applied data science. Like I say:
It just ain’t real 'til it reaches your customer’s plate
I am a startup advisor and available for speaking engagements with companies and schools on topics around building and motivating data science teams, and all things applied machine learning.
Reach me at amunategui@gmail.com


|

Easy Market Profile in Python: Grasp Price Action Quickly
Practical walkthroughs on machine learning, data exploration and finding insight.
Resources
Let’s build a market profile chart using Python in about 30 lines of code. This is a bare version of J.P Steidlmayer’s charting system, but should give you a good idea of market distribution within a particular time frame and where the market spent most of its time. Here we’ll focus on monthly distributions using end-of-day data from Yahoo Finance.
Yahoo's ichart service is down. You'll need to use Google Finance instead - source code at end of blog has been udpdated.
So, what is Market Profile?
A Market Profile is an intra-day charting technique (price vertical, time/activity horizontal) devised by J. Peter Steidlmayer, a trader at the Chicago Board of Trade (CBOT), ca 1959-1985. Steidlmayer was seeking to evaluate market value as it developed in the day time frame. Steidlmayer’s charts displayed a bell shape, fatter at the middle prices, with activity trailing off at the higher and lower prices. In this structure he recognized the ‘Normal’, gaussian distribution he had met with in college statistics… (Wikipedia: Market Profile)
J.P Steidlmayer would record intra-day pit action using a sideways distribution plot. This would give him insight as to where price spent the most time and where it struggled. In a lot of cases, the chart would form a normal distribution. Armed with this information along with visual and audible cues from floor traders, he could easily figure out when markets were stretched and how far the price would retract with high probability. And if the pits got excited around the distribution tails, he would stick it out assuming that new information came in and could potentially shake things up.
            246.00
            244.00:         B
            242.00:         BCMNPQRTU
            240.00:         CNOPR
            238.00:         DE
            236.00:         E
            234.00:
Today, unfortunately, there really isn’t any pit trading left to yield cues, but this is still a great way of looking at the market, better, or at least just as good as line or candlestick charts. Maybe in another video we’ll look at building an ‘excitement’ indicator to capture unusual market speed changes, price jumps, abrupt volume changes, etc. In the Market Profile we will build here, we will capture a year’s worth of trading using monthly profiles and daily letters.
Brief Look at the Code
Let’s look at the important components of the Market Profile code (for more details see the YouTube video). The Print_Market_Profile takes 5 parameters: the symbol you want to visualize, the height precision (or dollar precision), the time-frame frequency, and the market start and end date.
The market data is downloaded from Yahoo Finance using the pandas_datareader library:
fin_prod_data = pdr.get_data_yahoo(symbol.upper(), start_date, end_date)Which returns:
In [35]: fin_prod_data.head()
Out[35]:

                  Open        High         Low       Close    Volume  \
Date
2016-04-01  116.080002  116.980003  115.550003  116.930000  10405400
2016-04-04  116.669998  116.730003  116.070000  116.150002   7643700
2016-04-05  117.760002  117.930000  117.150002  117.660004   8865900
2016-04-06  116.699997  117.389999  116.260002  116.940002   7549400
2016-04-07  118.650002  118.849998  115.000000  118.610001  11900500

             Adj Close
Date
2016-04-01  116.930000
2016-04-04  116.150002
2016-04-05  117.660004
2016-04-06  116.940002
2016-04-07  118.610001
...
In order to scale the height of our chart, we multiply the high and low price with the
height_precision variable then round those values. The function defaults to dollar amounts, dropping everything after the decimal point. If a stock is trading in the $10 range, you will need to use a height_precision larger than one, and for a stock trading in the 100s, a height_precision smaller than one. How Many Profiles to Display?
We use Pandas’ TimeGrouper function to extract the end dates for each profile to know when to stop building a current profile and move on to the next.
time_groups = fin_prod_data.groupby(pd.TimeGrouper(freq=frequency))['Adj Close'].mean()In [32]: time_groups
Out[32]:
Date
2016-04-30 118.719524
2016-05-31 120.280477
2016-06-30 121.935908
2016-07-31 127.836500
2016-08-31 127.728261
2016-09-30 126.546667
2016-10-31 120.735239
2016-11-30 117.827619
2016-12-31 109.667143
2017-01-31 113.764501
2017-02-28 117.631579
2017-03-31 117.270870
2017-04-30 120.774167
Freq: M, Name: Adj Close, dtype: float64Hi there, this is Manuel Amunategui- if you're enjoying the content, find more at ViralML.com
Building the Character Profile One Column at a Time
The entire Market Profile is built and stored using a defaultdict object. We use the price as key and append characters, whether a profile character or a blank space. All price levels get characters, though most are spaces and tabs. We loop through each row in our market action data set and add our letters accordingly. The first entry of every new profile starts with ASCII value 65, which is character ‘A’, and we increment the character for every new time period (i.e. ‘A’, then ‘B’, then ‘C’, etc). Keep in mind that for large profiles containing lots of time periods, an ACSCII reset may be required once all characters are used (after ASCII 126).
Once we jump into a new TimeGrouper, the current profile is finished and a new one is started. This means bufferering all empty spaces vertically, adding a tab column, and resetting the ASCII character back to letter ‘A’. That’s really it.
Here is a look at the mp dictionary and its content:
In [44]: mp
Out[44]:
defaultdict(str,
{107: '\t \t \t \t \t \t \t \t \tK \t \t',
108: '\t \t \t \t \t \t \t \t \tJLMS \t \t',
109: '\t \t \t \t \t \t \t \t \tJT \t \t',
110: '\t \t \t \t \t \t \t \t \tACGHIJ\tAB \t',
111: '\t \t \t \t \t \t \t \t \tACD \t \t',
112: '\t \t \t \t \t \t \t \tQRTU \t \tCEFG \t',
113: '\t \t \t \t \t \t \t \tQRST \t \tFGIQR\t',
114: '\t \t \t \t \t \t \t \t \t \tHKLM \tA',
115: '\tE \t \tA \t \t \t \t \tNP \t \tKMNOT\tA',
116: '\tADE \tRS \t \t \t \t \t \tIJKLM\t \t \tDHIJK',
117: '\tCDEJK \tQS \t \t \t \t \t \tIL \t \t \tDEGHJKNO',
118: '\tEFINPRS\t \tCDE \t \t \t \tE \tI \t \t \tP',
119: '\tINOS \tNP \t \t \t \t \tDE \tI \t \t \tQRS',
120: '\tT \tFGJM \tFGPQ \t \t \t \tCNOPR \tH \t \t \t',
121: '\tT \tDFGIJM\tGHO \t \t \t \tBCMNPQRTU\tGH \t \t \t',
122: '\tU \tBCEK \tIJKLMN\t \t \t \tB \tAFG \t \t \t',
123: '\tU \tABE \tKLMN \t \t \t \t \tG \t \t \t',
124: '\t \t \tL \t \tW \tAK \t \tB \t \t \t',
125: '\t \t \tLRT \tP \tV \tAJLMU\tA \t \t \t \t',
126: '\t \t \tRSU \tIJKNR \tRT \tFGNR \t \t \t \t \t',
127: '\t \t \t \tGIKLNRS\tJT \tFN \t \t \t \t \t',
128: '\t \t \t \tBT \tAHIJLMN\tCD \t \t \t \t \t',
129: '\t \t \t \tBDEFT \tAJ \t \t \t \t \t \t',
130: '\t \t \t \tC \t \t \t \t \t \t \t',
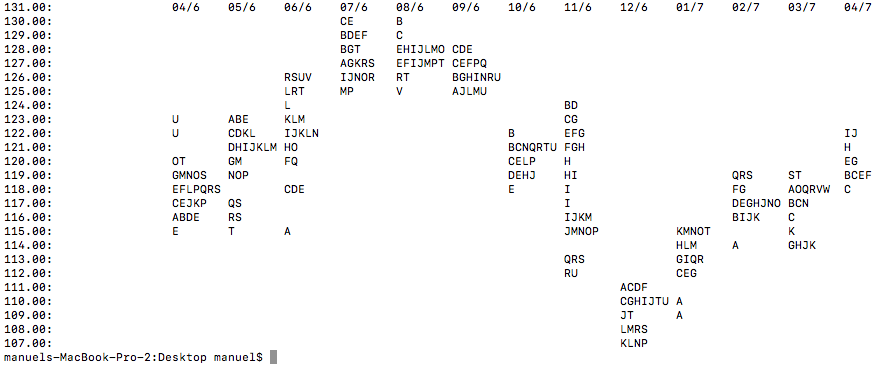
131.0: '\t04/6 \t05/6 \t06/6 \t07/6 \t08/6 \t09/6 \t10/6 \t11/6 \t12/6 \t01/7 \t02/7'})And here is the final display:
262.00:         04/6    05/6    06/6    07/6    08/6    09/6    10/6        11/6    12/6    01/7    02/7
260.00:                                 C
258.00:                                 BDEFT   AJ
256.00:                                 BT      AHIJLMN CD
254.00:                                 GIKLNRS JT      FN
252.00:                         RSU     IJKNR   RT      FGNR
250.00:                         LRT     P       V       AJLMU   A
248.00:                         L               W       AK                  B
246.00:         U       ABE     KLMN                                        G
244.00:         U       BCEK    IJKLMN                          B           AFG
242.00:         T       DFGIJM  GHO                             BCMNPQRTU   GH
240.00:         T       FGJM    FGPQ                            CNOPR       H
238.00:         INOS    NP                                      DE          I                       QRS
236.00:         EFINPRS         CDE                             E           I                       P
234.00:         CDEJK   QS                                                  IL                      DEGHJKNO
232.00:         ADE     RS                                                  IJKLM                   DHIJK
230.00:         E               A                                           NP              KMNOT   A
228.00:                                                                                     HKLM    A
226.00:                                                                     QRST            FGIQR
224.00:                                                                     QRTU            CEFG
222.00:                                                                             ACD
220.00:                                                                             ACGHIJ  AB
218.00:                                                                             JT
216.00:                                                                             JLMS
214.00:                                                                             K
Full Source Code:
import sys
import pandas as pd
import datetime
import numpy as np
from pandas_datareader import data, wb
import pandas_datareader as pdr
from collections import defaultdict

def Print_Market_Profile(symbol, height_precision = 1,
    frequency='m', start_date=None, end_date=None):

    # We will look at stock prices over the past year
    if start_date == None:
        # get a year's worth of data from today
        start_date = datetime.date.today() - datetime.timedelta(days=365.24)
        # set date to first of month
        start_date = start_date.replace(day=1)
    if end_date == None:
        end_date = datetime.date.today()

    fin_prod_data = pdr.get_data_google(symbol.upper(), start_date, end_date)
    fin_prod_data[('High')] = fin_prod_data[('High')] * height_precision
    fin_prod_data[('Low')] = fin_prod_data[('Low')] * height_precision
    fin_prod_data = fin_prod_data.round({'Low': 0, 'High': 0})

    time_groups = fin_prod_data.groupby(pd.TimeGrouper(freq=frequency))['Adj Close'].mean()
    current_time_group_index=0

    from collections import defaultdict
    mp = defaultdict(str)
    char_mark = 64

    # build dictionary with all needed prices
    tot_min_price=min(np.array(fin_prod_data['Low']))
    tot_max_price=max(np.array(fin_prod_data['High']))
    for price in range(int(tot_min_price), int(tot_max_price)):
        mp[price]+=('\t')

    # add max price as it will be ignored in for range loop above
    mp[tot_max_price] = '\t' + str(time_groups.index[current_time_group_index])[5:7] + '/' + str(time_groups.index[current_time_group_index])[3:4]

    for x in range(0, len(fin_prod_data)):
        if fin_prod_data.index[x] > time_groups.index[current_time_group_index]:
            # new time period
            char_mark=64
            # buffer and tab all entries
            buffer_max = max([len(v) for k,v in mp.iteritems()])
            current_time_group_index += 1
            for k,v in mp.iteritems():
                mp[k] += (chr(32) * (buffer_max - len(mp[k]))) + '\t'
            mp[tot_max_price] += str(time_groups.index[current_time_group_index])[5:7] + '/' + str(time_groups.index[current_time_group_index])[3:4]


        char_mark += 1
        min_price=fin_prod_data['Low'][x]
        max_price=fin_prod_data['High'][x]
        for price in range(int(min_price), int(max_price)):
            mp[price]+=(chr(char_mark))

    sorted_keys = sorted(mp.keys(), reverse=True)
    for x in sorted_keys:
        # buffer each list
        print(str("{0:.2f}".format((x * 1.0) / height_precision)) + ': \t' + ''.join(mp[x]))

def main():
    # customize ingestion of agruments to handle
    # frequency: http://nullege.com/codes/search/pandas.TimeGrouper

    if (len(sys.argv[1:]) == 1):
        symbol = sys.argv[1:][0]
        Print_Market_Profile(symbol)
    elif (len(sys.argv[1:]) == 2):
        symbol = sys.argv[1:][0]
        height_precision = float(sys.argv[1:][1])
        Print_Market_Profile(symbol, height_precision)
    elif (len(sys.argv[1:]) == 3):
        symbol = sys.argv[1:][0]
        height_precision = float(sys.argv[1:][1])
        frequency = sys.argv[1:][2]
        Print_Market_Profile(symbol, height_precision, frequency)

if __name__ == "__main__":
    main()
Manuel Amunategui - Follow me on Twitter: @amunategui